The Role of Data Analytics in Business and Personal Financial Decision-Making: A Statistical Analysis of UK Income and Taxation
1
The Role of Data Analytics in Business and Personal Financial Decision-Making: A Statistical Analysis of UK Income and Taxation
Daniel Foster
ECON3024 – Data Analytics for Financial Decision-Making
Dr. Rachel Whitmore
10 March 2025
2
The Role of Data Analytics in Business and Personal Financial Decision-Making: A Statistical Analysis of UK Income and Taxation
1. Impact of Statistics in Business
The Role of Data Analytics in Business Performance
Statistics and data analysis are indispensable to the ever-growing need for data in how we live nowadays, as well as with the trends in business. Data collection, analysis, and interpretation enable organisations to reduce risk and uncertainty and reveal new patterns (Awan et al., 2021). Competition in the current business world has risen, and every company wishes to be relevant and efficient; therefore, statistical techniques have been enhanced (Awan et al., 2021). Different sectors use data analysis to forecast customer buying patterns, risks, and supply chains in financial, health, manufacturing, and retail industries.
One of the benefits of using statistics in the area of business is that it aids in decision-making. Traditional business strategy is based on assumptions and premises of what has been carried out, while contemporary organisations prefer to apply research findings (Awan et al., 2021). It is a fact that many companies can analyse their past performance using statistical tools and analyse the patterns that will occur in the future. For instance, in the retail industry, firms compute sales data to determine customers’ choices, manage inventory, and create customised advertising strategies (Awan et al., 2021). In the same way, statistical models are applied in finance for credit risk analysis, fraud detection and investment purposes. Data analytics in healthcare refers to the evaluation of large data sets to determine the likelihood of certain risks and enhance the effectiveness of the treatments (Awan et al., 2021). The following gives you an idea of how statistics help businesses to make the right decisions that will lead to the business’s success.
3
Assessing performance and making further enhancements is one of the most important uses of business statistics. When it comes to A/B testing, it is a method we can use to test out two options for one problem and see what works best (Awan et al., 2021). This method is used in digital marketing where the business runs multiple advertisements to check the level of engagement and conversion (Awan et al., 2021). On the same note, statistical clustering methods assist in categorising the customers for the provision of specific products or services. Thus, customer needs and preferences should be identified to increase customer satisfaction and develop long-term relations with them.
The Three Vs of Big Data
The advancement in big data analytics has further enhanced business operations by enabling organisations to analyse extensive data. Big data’s Three main features are volume, velocity, and variety (Cappa et al., 2021). Big data can be described as the large quantity produced daily, be it customers’ purchases or social media activity. Velocity emphasises how faster data is generated and processed to assist companies in making decisions. Variety can refer to structured data like sales records or unstructured data like customer reviews or videos (Cappa et al., 2021). Companies that can successfully address the challenge of big data and learn how to use it will be able to get insights into the tendencies of the market, customers and their performance.
Challenges in Adopting Data Analytics in Business
Data analytics requires a professional human resource who can analyse various data to provide valuable information. However, there are challenges that many organisations experience, one of them being skills shortage, whereby the demand for data analysts and statisticians is high (Cappa et al., 2021). To meet this need among businesses, training and education of the employees on analytical skills is essential (Cappa et al., 2021).
4
Moreover, using advanced analytical tools is costly, and it may not be possible for SMEs to compete with larger organisations with the resources to pay for such services. Therefore, businesses can use inexpensive solutions such as cloud-based analytics to analyse data efficiently without spending much money on hardware.
The other challenge that organisations encounter when implementing business intelligence is the issue of resistance to change (Cappa et al., 2021). There are some reasons why employees and managers may resist new analytical methods, especially for organisations that are more inclined towards traditional business methods (Cappa et al., 2021). To meet this challenge, organisations must use data and culture by demonstrating how statistics can enhance organisational processes, reduce expenses and generate more revenues (Cappa et al., 2021). One way to mitigate this challenge is to involve data analysts and managers or other decision-makers in the same team so that the analyst’s technical knowledge is incorporated into the business plans.
2. Data Visualisation: UK Income Data
UK Median Income Trend
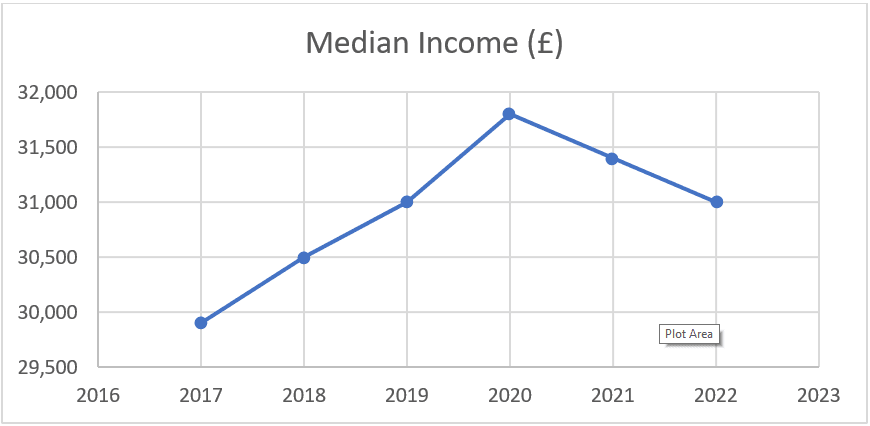
Figure 1: UK Median Income Trend
5
UK Mean Household Income Trend
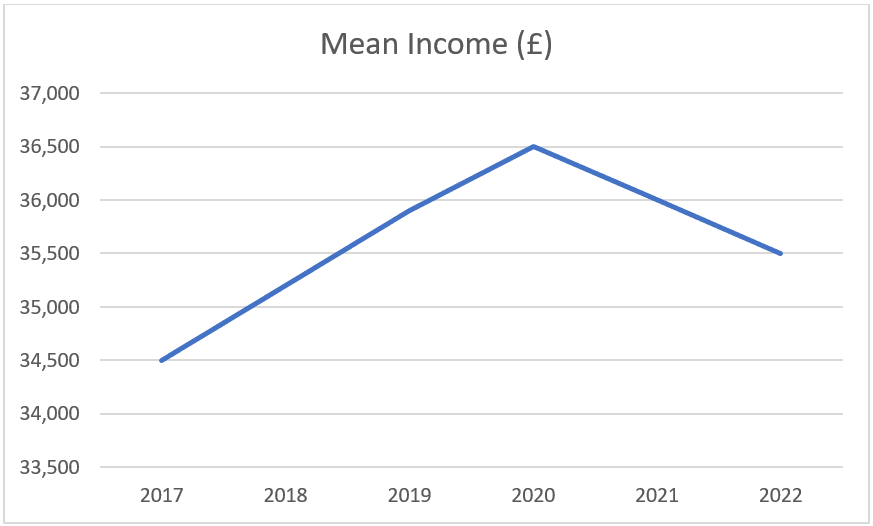
Figure 2: UK Mean Household Income Trend
The UK household income data analysis from 2017 to 2022 reveals notable trends and economic fluctuations. Total per capita disposable income was higher in 2020 than in 2017. However, the mean and median of the disposable income per household have been reduced in 2021 and 2022 (Brewer & Tasseva, 2021). The median income, which eliminates the highest and the lowest earners, rose from £29, 900 in 2017 to £31, 800 in 2020 before slightly declining to £31, 000 in 2022 (GOV.UK., 2024). In the context of the total income earners, the mean income increased from £34,500 in the year 2017 to £36,500 in 2020, but came down to £35,500 in 2022.
This is the case since after the year 2020, income is anticipated to reduce because of COVID-19, which impacted the economy, inflation, and support measures. The earnings of households were affected by COVID-19 measures, including the lockdown, job losses, and reduced working hours, while living expenses reduced the available income (Brewer & Tasseva, 2021). The fact that the mean income has slightly decreased would mean that earners in the higher income group could have been affected more to lead to the decrease in the mean income. However, the fact that the median income remained stable the burden was not very much on the middle-income households.
6
Comparative Analysis of Mean and Median Income in the UK
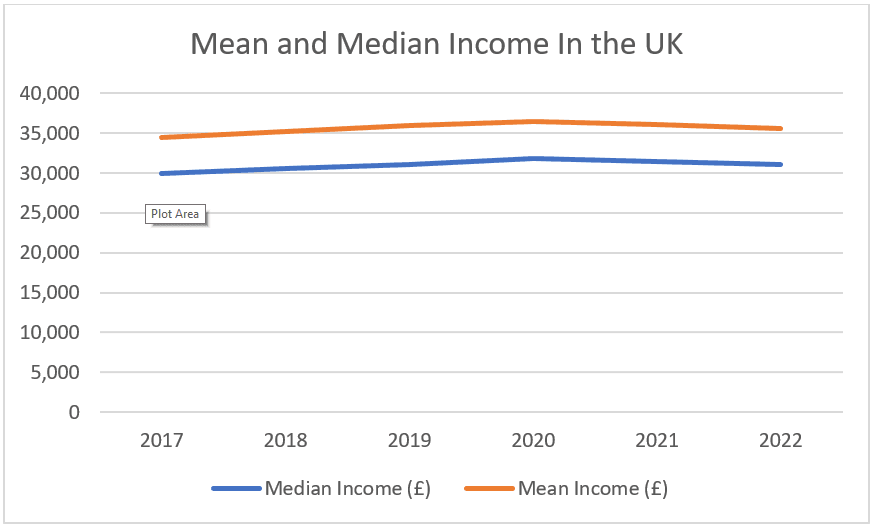
Figure 3: Mean Vs. Median Income in the UK 2017-2022
A comparison of the mean and median household incomes in the UK for 2017 and 2022 reveals some of the facts and the changes in the level of income inequality in the UK. The mean income, including all the households’ income, was also higher than the median income, meaning higher earners greatly impacted the average (Brewer & Tasseva, 2021). This is due to income inequality, whereby a few people with high incomes distort the mean.
Incomes from 2017 to 2020 were higher on average and in the middle, which means that the economic status, wages, and employment were better over time. Nonetheless, the two have been on a downward trend since 2020, though this could be attributed to the effects of the COVID-19 pandemic, inflation, and cuts in government subsidies (Brewer & Tasseva, 2021). The higher earners may have received a more significant percentage cut based on the mean income.
7
Conversely, the median income did not fluctuate much, suggesting that the median income earners were not affected much.
Summary of the Findings
The data on UK household income proves the economic growth from 2017 to 2022, with a decline in 2021 and 2022. Mean and median incomes rose gradually, indicating that the financial situation remained relatively stable until 2020. Nonetheless, a decrease was observed in the post-pandemic period, probably because of COVID-19, inflation, and less government subsidies (Brewer & Tasseva, 2021). The mean was still higher than the median, indicating that high-income people increased the average. The extreme values have less influence on standard deviation; therefore, the measure of typical income is more accurate when calculated using the median income level (Brewer & Tasseva, 2021). These observations call for progressive economic policies and wage support schemes.
3. Explanation of Tax Code 1257L
The tax code 1257L is used by individuals with only one source of income, for instance, wages, pension, or other earned income, no other taxable income, and no taxable benefits (Paccione, 2023). The numbers (1257) in the tax code refer to the tax exemption known as the Personal Allowance, which is £12,570 annually (GOV.UK., 2024). This is one of the reasons that makes it possible for them to earn up to £12,570 before being required to pay Income Tax. The letter (L) also means that the individual is entitled to gross exemptions of the personal allowance without any reduction for benefits, marriage allowance, or otherwise (GOV.UK, 2024 ).
UK Income Tax and National Insurance Calculations
| Income Tax Calculation for a £35,000 Salary | ||
| Personal Allowance | Up to £12,570 | 0% tax |
8
| Basic Rate | £12,571 to £50,270 | 20% tax |
| Higher Rate | £50,271 to £125,140 | 40% tax |
| Additional Rate | 0ver £125,140 | 45% tax |
Table 1: Tax Regimes in the UK
For a £35,000 salary, the tax calculation is
First £12,570 – Tax-free (Personal Allowance)
Remaining £22,430 (£35,000 – £12,570) – Taxed at 20%
Tax due: £22,430 × 20% = £4,486
The total Income Tax payable is £4,486 per year (GOV.UK., 2024)
National Insurance Calculation for a £35,000 Salary
| Monthly Salary Bracket | NI Contribution Rate (Category L) |
| Up to £533 | 0% |
| £533 to £758 | 0% |
| £758.01 to £2,083 | 13.8% |
| Over £2,083 | 13.8% |
Table 2: Insurance rates
NI is calculated for a £35,000 annual salary (£2,916.67 per month).
First £758 – 0% NI
Remaining £2,158.67 (£2,916.67 – £758) – 13.8% NI
NI Contribution: £2,158.67 × 13.8% = £297.94 per month
Annual NI Contribution: £297.94 × 12 = £3,575.28
Suppose a person earns £35000 per year under tax code 1257L. In that case, income tax and national insurance are deducted from the income, amounting to £4486 and £3575.28, respectively.
9
This makes the net income £26938.72 before other deductions such as pensions or student loans (Paccione, 2023). This shows how tax bands and National Insurance affect the amount one takes home, and that knowledge of such codes is crucial for a person to plan their finances well.
3. Summary Statistics Analysis
| Statistic | Value in GBP |
| Mean | 192.08 |
| Mode | 180 |
| Median | 190 |
| Standard deviation | 11.93 |
| Skewness | 0.15 |
Table 3: Statistics for food expenses
Interpretation of Food Spending Patterns
The mean of £192.08 is slightly more significant than the ONS per-person estimate of £181 but still falls within an acceptable range. The fact that the median is £190, which is not far from the mean, also indicates that the spending pattern is balanced with slight skewness (Paccione, 2023). The mode (£180) reveals that this figure is most common in the two-year data set; therefore, it can be considered a typical spending behaviour.
A standard deviation of £11.93 means moderate volatility in the amount spent on food, perhaps because of seasonal differences, sales offer, or changes in the type of food consumed. The skewness of 0.15 indicates positive skewing, implying a slight inclination towards higher spending in some months due to factors such as the high cost of groceries, December being a month-end, or a change in people’s lifestyles (Paccione, 2023).
10
Recommendation Based on ONS Data
The average monthly food expenditure in the household is £192.08, which is relatively higher than the ONS estimate of £181 per person. However, it can be seen that there are possibilities for making reasonable changes to increase the efficiency of the budget spending. Meal planning is a valuable strategy because it avoids food waste and the over-purchase of food items (Paccione, 2023). Moreover, costs are also reduced by purchasing large quantities and through supermarkets, and it is still possible to retain quality (Paccione, 2023). It is also possible to compare the retailers and use the loyalty programmes to optimise the savings further (ONS, 2024). Due to seasonal variations in spending, it would be advisable to set a definite amount that should be spent on food every month (Paccione, 2023). By making some modifications, the household can achieve more approximate figures to the national average expenditure for food while being able to eat balanced meals.
4. Risk Analysis
a. Probability of Meeting Savings Goal
The probability is 0.5833 or 58.33%
b. Probability Comparison: 2023 vs. 2024
Therefore, the probability of savings behaviour not changing between 2023 and 2024 is valid since the probabilities of both years are 58.33%. This indicates that the company has consistently achieved the targeted savings in successive years (Alam et al., 2022). However, fluctuations in monthly savings may suggest specific problems in some months; for instance, in December, there are likely to be so many expenses incurred, such as during the festive season (Alam et al., 2022). This pattern shows the need to save more, especially when high expenditure, to have better savings stability in the following year.
11
c. Probability of Meeting Savings Goal Exactly 4 out of the Next 6 Months
The probability of achieving the savings goal of exactly $4 out of the following 6 months is 30.12%.
d. Does ‘Met_Savings_Goal’ Support Binomial Probability Analysis?
The Met_Savings_Goal variable is suitable for binomial probability analysis because it satisfies the conditions of the binomial distribution. First, there are only two choices for the monthly savings: one is to achieve the target (1), and the other is not (0). Second, each month is a fixed trial, and the probability of success in achieving the goal is relatively constant at 58.33% (Alam et al., 2022). Third, while some factors that affect savings, such as seasonal expenditures, may affect the total amount of money saved in a year, individual months can be treated as different events. Since the given dataset satisfies these conditions, binomial probability can be used to estimate future savings success and evaluate the financial risks.
e. Risk Analysis and Recommendations
The probability of attaining the saving goal is 58.33 per cent, and the likelihood of achieving the goal precisely in the next four out of six months is 30.12 per cent. This shows that the savings behaviour is relatively stable over the year, but the monthly fluctuations can be explained by the fact that there are many expenses during the year (Alam et al., 2022). To minimise the risk and ensure that the costs are consistent, there are ways to plan for irregular expenses, such as saving automation, budgeting, and emergency funds (Alam et al., 2022). Furthermore, managing the spending patterns in months of high expenditures, like after Christmas, shall also improve financial stability. By adopting these measures, the family member can improve their chances of saving as frequently as required towards the set goal.
12
Conclusion
This analysis shows the need to be innovative when using data in decision-making, especially in income, taxation, spending, and saving. The UK household income analysis observed moderate changes based on economic factors and inflation. Calculating taxes explained how progressive taxes impact disposable income; therefore, the analysis of food expenditure enabled the understanding that small changes can enhance the budget. The savings goal probability revealed moderate financial risk and thus required automation in saving and spending. When these methods are applied, it is easy for people to make sound decisions in matters related to finances, and thus, they can attain economic stability in the long run.
13
References
Alam, M. A. Z., Yong, C. C., & Mansor, N. (2022). Predicting savings adequacy using machine learning: A behavioural economics approach. Expert Systems with Applications, 203, 117502.
Awan, U., Shamim, S., Khan, Z., Zia, N. U., Shariq, S. M., & Khan, M. N. (2021). Big data analytics capability and decision-making: The role of data-driven insight on circular economy performance. Technological Forecasting and Social Change, 168, 120766. https://doi.org/10.1016/j.techfore.2021.120766
Brewer, M., & Tasseva, I. V. (2021). Did the UK policy response to Covid-19 protect household incomes?. The Journal of Economic Inequality, 19(3), 433-458. https://doi.org/10.1007/s10888-021-09491-w
Cappa, F., Oriani, R., Peruffo, E., & McCarthy, I. (2021). Big data for creating and capturing value in the digitalized environment: unpacking the effects of volume, variety, and veracity on firm performance. Journal of Product Innovation Management, 38(1), 49-67. https://doi.org/10.1111/jpim.12545
GOV.UK. (2024). Check what your tax code means. Retrieved from https://www.gov.uk/guidance/check-what-your-tax-code-means
GOV.UK. (2024). Income Tax rates and Personal Allowances. Retrieved from https://www.gov.uk/income-tax-rates
GOV.UK. (2024). National Insurance rates and categories. Retrieved from https://www.gov.uk/national-insurance-rates
Office for National Statistics (ONS). (2024). Average household income, UK: financial year ending 2022. Retrieved from https://www.ons.gov.uk/
Office for National Statistics (ONS). (2024). Effects of taxes and benefits on household income. Retrieved from https://www.ons.gov.uk/
Paccione, P. (2023). Parliament and Taxation: 1604-1689.